Last week, the US market saw a fall in long-term interest rates and the VIX, and there was strong movement in the stock price index, particularly in the Nasdaq and other high-tech stocks. On the other hand, there are an increasing number of stocks that have entered a short-term downward trend, so it is a situation that requires some caution.
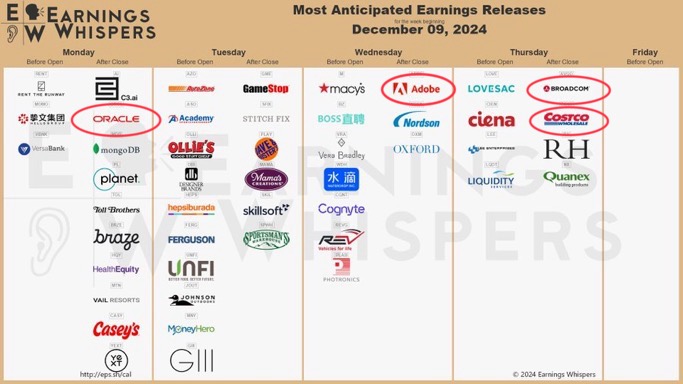
This week, I'd like to focus on the financial results for ORCL, ADBE, ORCL, and COST, as well as the market reaction after the CPI announcement on December 11.
Now, let's review last week's market by checking the chart.
Last Week in Review
Market environment
The 10-year US Treasury note fell by -0.60%. This is the third consecutive week of falls, and it is in a short-term downtrend. It is positive for stock indices.
The VIX fell by -5.48%. The VIX has also fallen for three consecutive weeks. Looking at the past two years, it often stopped falling around 12. It seems a good idea to carefully observe whether the VIX will stop falling and start to rebound.
The percentage of stocks in an uptrend has fallen significantly from overbought levels, and has entered a short-term downtrend. The NASDAQ and S&P 500 indices continue to rise, but looking at the market as a whole, it is clear that the number of stocks that have switched to a short-term downtrend is increasing.
NASDAQ Analysis
This is a monthly chart of the NASDAQ. The first week of December has ended, and the current rate of rise is +3.28%. It has made a strong start, following on from last month.
This is a weekly chart of the NASDAQ. Last week, it rose by 3.28% and exceeded the November high to set a new high.
The number of stocks with high and low prices on the NASDAQ is in positive territory, but is on a downward trend in the short term. Until it turns around, it is necessary to watch the situation with some caution. When the NASDAQ index is rising and this chart is falling, it indicates that stocks other than large-cap tech stocks are relatively weak.
Dow Analysis
This is a monthly chart of the Dow. The current rate of change for December is -0.64%. This is a correction from the very strong rise seen last month. The strong rise in November has led to a sudden increase in the deviation from the moving average.
This is the weekly chart for the Dow. Last week, it fell by -0.64%. It has returned to the resistance line around 44,500. It seems likely that there will be some back and forth around this area.
Analysis of the S&P 500
This is a monthly chart of the S&P 500. As of December, the rate of increase/decrease is +0.95%. The record high continues to be updated.
This is a weekly chart of the S&P 500. Last week, it rose by 0.95%. It has been rising steadily for three consecutive weeks.
Russell 2000 Analysis
This is a monthly chart of the Russell 2000. The current December gain/loss rate is -1.29%. As with the Dow, we can see that it is entering a period of adjustment after the very strong rise of last month.
This is a weekly chart of the Russell 2000. Last week, the index fell by 1.29%. This is a short-term bearish chart, as the fall last week cancelled out the rise in the previous week.
Commodity Futures Analysis
Crude oil fell by -1.49%. It has fallen for two consecutive weeks and is approaching the resistance line around 66, which has rebounded many times in the past. Whether or not it can maintain this level will be the key.
Natural gas fell by -8.53%. It has returned to the vicinity of the rising trend line. The rising trend that began in October is barely being maintained, but the chart looks like it will continue to trend downward in the short term.
Gold fell by -0.80%. It has fallen for two consecutive weeks, with a lower wick each time. Gold often rises when long-term interest rates fall, but in the last two weeks, gold has fallen along with interest rates. We can see a trend of buying when it approaches the 20 EMA and then rebounding.
Copper rose by +1.36%. This is the third consecutive week of rises. The downward trend that began in the second half of September has yet to be broken. The price has been sold off when it touched the downward trend line, and it looks like the sellers are still in the lead.
Sector Analysis
Last week, there was a clear distinction between sectors, with consumer goods, telecommunications services and information technology rising, and other sectors falling. In particular, energy and utilities were weak. Over the past month, consumer goods have been strong, while materials, energy and healthcare have been weak.
Looking at weekly performance by industry, last week was strong for automobiles, internet retail, internet, games, computer hardware, software, and semiconductors, and weak for health insurance, coal, and oil.
Trend of Individual Issues
Last week, the upper left (high-tech related) rose, while the lower right (energy and industrial related) fell. The big gainers were tech stocks with large market capitalizations, such as AMZN, TSLA, META, TSM, AVGO, and CRM. On the other hand, the big losers were health insurance stocks such as UNH and ELV, oil and gas-related stocks such as CVX and COP, housing construction stocks such as DHI and LEN, and logistics stocks such as UPS and FDX.
Strategy of the Week
Last week, there was strong movement in high-tech stocks, and stocks that announced good earnings results rose strongly as a result of strong buying, but on the whole, there are more and more stocks that are falling from overbought levels, so the market environment requires a little caution.
This week, as with last week, I will reduce my positions in stocks that have risen significantly, increase my cash reserves, and prepare for the next wave of rises after the next correction.
Stocks to watch
We have added ASAN, CRDO, and LULU, which saw strong rises after last week's earnings announcements, to our watch list.
Click here to see a chart of the stocks monitored.
Scheduled to announce financial results this week
This week, we will be focusing on the financial results of ORCL, ADBE, ORCL, and COST.
12/9
AI BRZE CASY HQY MDB MTN ORCL TOL
12/10
ASO AZO FERG OLLI
GME
12/11
M
ADBE NDSN
12/12
CIEN
AVGO COST RH