Last week, the Nasdaq rose while long-term interest rates rose in the US market, and other stock price indexes fell.
Crude oil is rising strongly, and there are signs of a fall in natural gas, gold and copper after a brief rise.
Although some stocks such as TSLA and AVGO are driving the rise in the NASDAQ, looking at the market as a whole, there is an increasing number of stocks that are in a short-term downtrend, so caution is needed.
This week, the FOMC meeting will be held on December 18th. This week's notable earnings reports are from MU, ACN, NKE, and FDX.
Let's review last week's market by checking the chart.
Last Week in Review
Market environment
The yield on 10-year US Treasuries rose sharply to +5.92%, rebounding strongly from three consecutive weeks of decline. In the previous week, it looked like it was about to enter a short-term downtrend, but this week's move seems to have cancelled that out.
The VIX rose by 8.15%, rising from 12 to 13.8. There has been no significant movement to change the trend yet.
The ratio of stocks in an uptrend has fallen to below 20%. The downtrend is continuing, and there are no signs of a rebound yet. We are in the 10-20% zone, where there was a high probability of a rebound occurring in the past.
NASDAQ Analysis
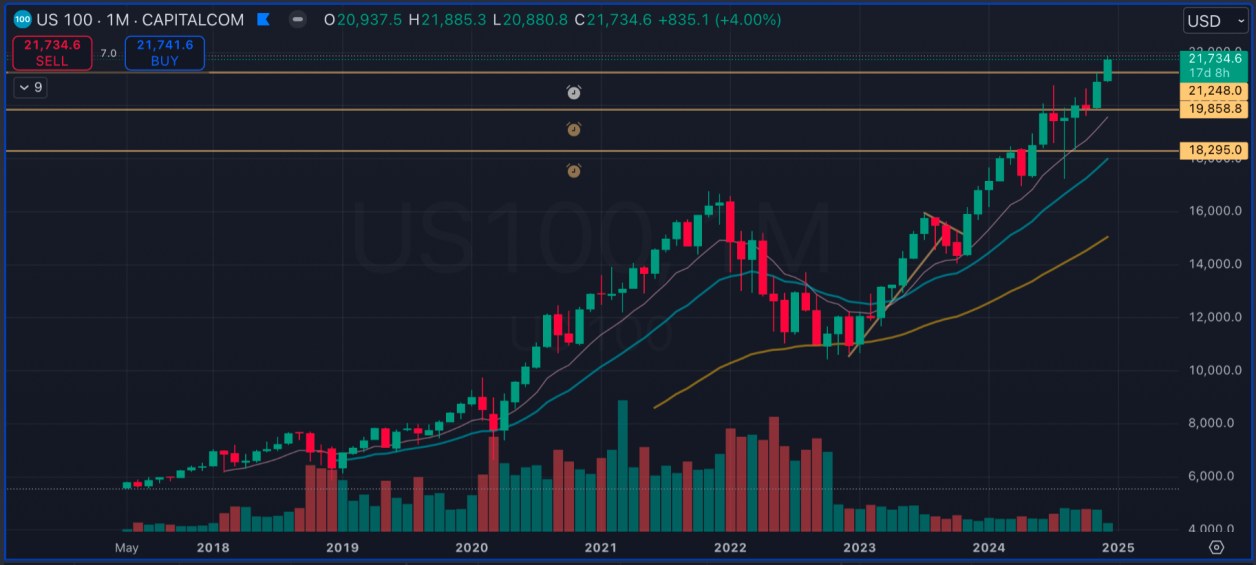
This is a monthly chart of the NASDAQ. The rate of increase/decrease for December was +4.0%, making it the strongest performing stock index. While many stocks are in a downward trend, some high-tech stocks with large market capitalizations are driving the index upwards.
This is a weekly chart of the NASDAQ. Last week, it rose by +0.69%. It has reached a new high.
The number of stocks on the NASDAQ that have reached new highs and lows continues to fall, and is now in negative territory. While the NASDAQ index is rising, the number of stocks that are reaching new lows and falling is increasing. So far, there are no signs that the decline is about to reverse.
Dow Analysis
This is a monthly chart of the Dow. The rate of change in December was -2.46%, showing weak movement in contrast to the NASDAQ.
This is the weekly chart for the Dow. Last week, it fell by -1.83%, making it the second week in a row that it has fallen. In the past few months, it has been rising strongly, so it looks like it is temporarily adjusting to return to the average.
Analysis of the S&P 500
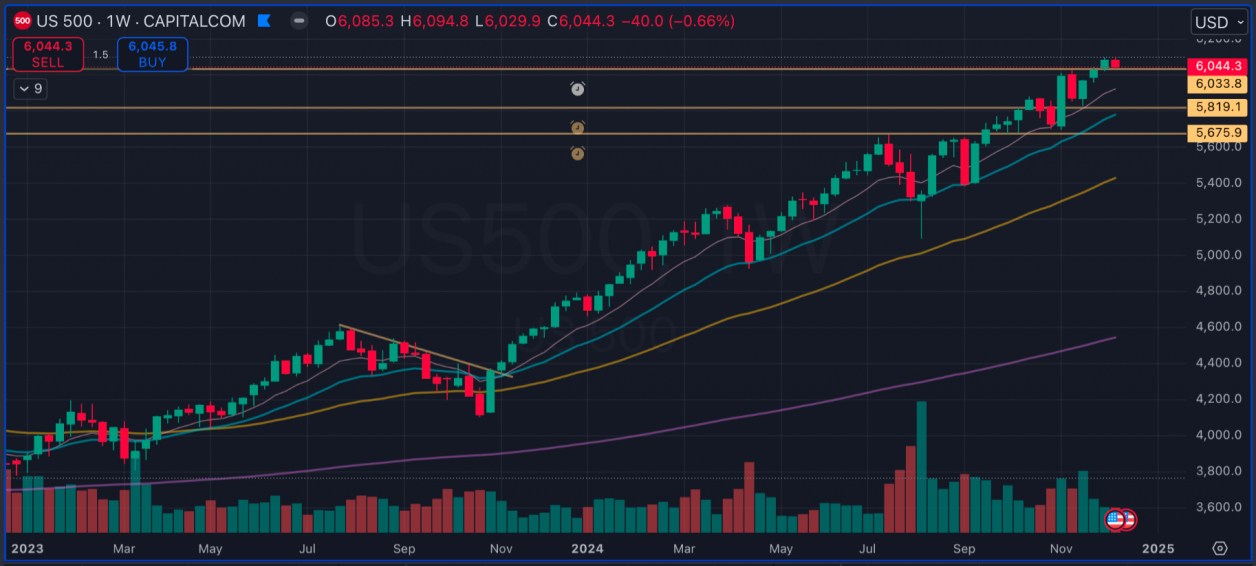
This is a monthly chart of the S&P 500. The rate of increase/decrease for December was +0.29%, which is exactly halfway between the performance of the Nasdaq and the Dow.
This is a weekly chart of the S&P 500. Last week, it fell by -0.66%. It seems that the three-week streak of rises has come to an end and it is entering a period of adjustment.
Russell 2000 Analysis
This is a monthly chart of the Russell 2000. The rate of change for December was -3.93%. After reaching a new high due to a strong rise in the previous month, it is now adjusting in a way that returns to the average.
This is a weekly chart of the Russell 2000. Last week, there was a rather large decline of -2.67%. This is the second consecutive week of decline following the previous week. There are still no clear signs of a rebound. It seems likely that there will be a decline to the support line around 2274.
Commodity Futures Analysis
Crude oil has risen strongly by 5.84%, from 67 to 71. As with the movements of the past two years, it seems that buyers will become dominant when it falls to around 67.
Natural gas rose by +6.63%. It failed to exceed 3.57 and returned. It has a wick on the top and bottom, and it seems that the direction is not fixed.
Gold rose by +0.61%. After rising in the first half of the week, it fell, and a large upper wick was formed. It seems to have been negatively affected by the rise in long-term interest rates.
Copper was flat at +0.01%. Like gold, it has a large upper wick, and it has returned without being able to break the downtrend.
Sector Analysis
Last week, telecommunications services and consumer staples were strong, while all other sectors fell. Healthcare and utilities were particularly weak. Looking at the month as a whole, consumer staples and telecommunications services were strong, while healthcare and energy were weak.
Looking at performance by industry, the pharmaceuticals retail, automobile, wine and beverage, and internet sectors are strong, while the materials-related sectors such as uranium, aluminum, and iron are weak.
Trend of Individual Issues
GOOGL, TSLA, AVGO, ARM, and BA rose strongly last week. On the other hand, software (ORCL, ADBE), semiconductors (NVDA, AMD), telecommunications (TMUS, CMCSA, CHTR), housing (DHI, LEN), pharmaceuticals (LLY, BMY), health insurance (UNH, CVS, CI), and steel (NUE, STLD) were weak.
Strategy of the Week
Looking at the overall market, the short-term downward trend is continuing, so I think we should wait for the market to turn around before making any new trades this week.
If the market mood changes depending on the reaction to the FOMC Chairman's press conference on December 18 and the MU's earnings after that, we will actively look for new trading opportunities.
Stocks to watch
AVGO, which saw a strong rise after last week's earnings announcement, has been added to the list of companies to monitor.
Click here to see a chart of the stocks monitored.
Scheduled to close this week
This week, we will be focusing on the earnings reports of MU, ACN, NKE, and FDX.
12/16
MITK CMP
12/17
AMTM HEI
12/18
BIRK GIS ABM TTC JBL
MU LEN MLKN SCS WS
12/19
ACN DRI CTAS FDS PAYX CAG KMX LW
NKE FDX AVO
12/20
CCL WGO