Last week saw the start of the third quarter 2024 earnings release season with major banks announcing earnings results, with JPM, WFC, BLK, and others all reporting results that exceeded market expectations, driving the overall market higher.
With long-term interest rates rising and the VIX continuing its gradual rise, the number of stocks in an uptrend is about to turn from a short-term decline to an uptrend. The overall market is at a level where a large percentage of stocks are overbought, so the uptrend wave may be short-lived, but I would like to take advantage of this if a new uptrend is confirmed to begin.
This week I will be focusing on earnings from BAC, GS, ASML, MS, and TSM. Whether or not the overall market rises again this week will depend on whether we see good earnings announcements from these stocks as well.
Now, let's review last week's market by checking the chart.
Last Week in Review
Market environment
The yield on the 10-year U.S. Treasury note was up +3.40%. It continues to rise after the trend turned from down to up last week.

The VIX was up +6.51%. It is still in a gradual uptrend, but appears to be about to begin a decline with an upward whisker.

The number of stocks in an uptrend is about to reverse from the short-term downtrend that began in mid-September and begin to rise. The trend reversal has not yet been confirmed.

NASDAQ Analysis
Monthly chart. The current rate of return for October is +1.08%.

Weekly chart. Last week we were up +1.16%, hovering near the resistance line at 20345. If we can clearly break above this, a new rise is likely to follow.

The Nasdaq high-low issue count had temporarily fallen into negative territory, but rebounded strongly late last week to return to positive territory. The key will be to see if it can stay in positive territory this week.

Dow Analysis
Monthly chart. At the moment, the rate of return for October is +1.34%. So far we have seen the possibility of a scenario where the market rises for 6 consecutive months.

Weekly chart. Last week it was up +1.22%, reaching a new high above the resistance line at 42674. It continues in a stable uptrend.

Analysis of the S&P 500
Monthly chart. At this point in time, the October return is +1.00%. As with the Dow, the possibility of a scenario where the market rises for 6 consecutive months is now possible.

Weekly chart. Last week it was up +1.09%, making a higher high above the 5774 resistance line. Like the Dow, it continues its stable uptrend.

Russell 2000 Analysis
Monthly chart. At this point in time, the October return is back in positive territory at +0.13%.

Weekly chart. Last week it was up +0.93%; it has had three straight weeks of lower beards and there seems to be a deep-seated force that wants to buy when they sell off and fall. If long-term interest rates, which have been a headwind for small-cap stocks, stop rising, small-cap stocks may begin to rally.

Commodity Futures Analysis
Crude oil was up +1.41%. It has large beards on the top and bottom, and there is some hesitation in the direction, but for now, it remains on the upside.

Natural gas was down -7.78%, with a move to lower highs since 2023 and a move to higher lows since 2024. After this, if the price can break above 3180 after the lows, it will have a better chance of continuing to rise.

Gold was up a modest +0.32%. It has a slightly larger lower whisker. It has maintained its uptrend even as long-term interest rates are rising. It is likely to continue rising if long-term interest rates stop rising.

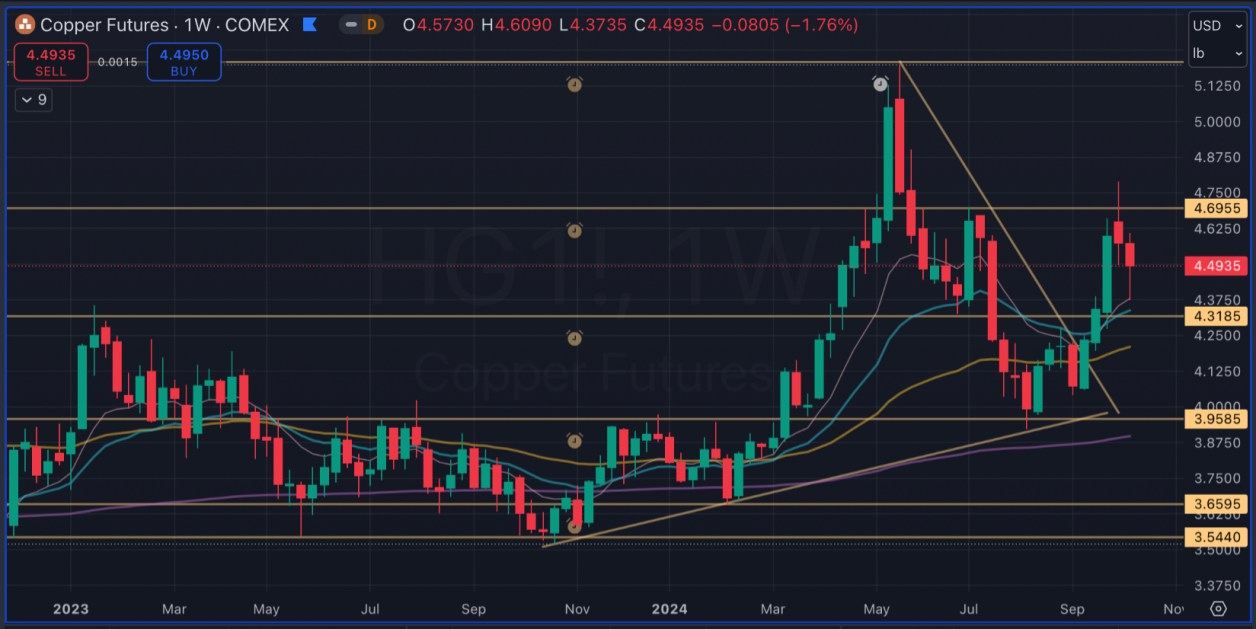
Copper was down -1.76%, falling to around 4.37 where it rebounded with a large lower whisker. There may be another test of 4.37 this week. If interest rates stop rising, there could be a scenario where the market rebounds and rises from here.

Sector Analysis
Last week, Information Technology, Industrials, Health Care, and Financials performed strongly, while Utilities, Communication Services, and Consumer Staples performed weakly. Over the past month performance has seen strong gains in all sectors except real estate, health care, and defensives.

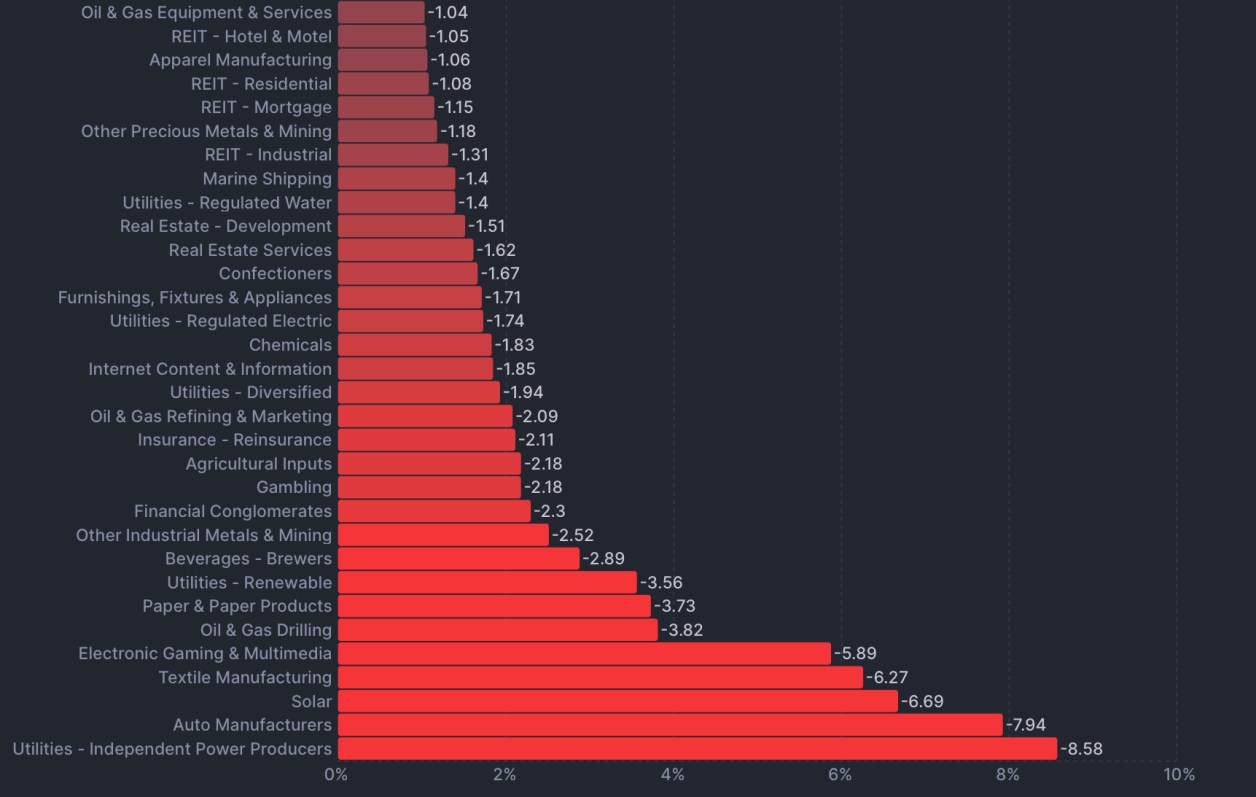
Weekly performance by industry is strong for pharmaceutical retailing, semiconductors, computer hardware, and trucks, and weak for utilities power, autos, and solar.


Trend of Individual Issues
Last week saw strong moves in semiconductors (NVDA, ARM), mid-sized software (PANW, PLTR, SNPS, ZS, UBER), computers (ANET, DELL), and banks (JPM, WFC). The big decliners were automobiles (TSLA), Chinese stocks (PDD, JD), and utilities (VST, CEG).

Strategy of the Week
Earnings season began last week with the announcement of earnings results from major banks, with JPM, WFC, and BLK rising and their earnings results coming in above market expectations. While there were warnings that the economy would begin to slow down and corporate earnings would begin to be affected, the good earnings were an unexpected surprise, and the overall market seems to be rising.
Since the market as a whole has a large percentage of overbought issues, it could be a short-term upward wave, but once a new uptrend is established, we will find opportunities for swing trades and add new positions.
The number of stocks scheduled to announce earnings this week will increase significantly. We will continue to trade with a focus on stocks that had positive surprises with good earnings.
Stocks to watch
We have added AEHR and BLK to our watch list, which showed strong movement after last week's earnings announcement.

Click here to see a chart of the stocks monitored.
This week's earnings release
This week we will focus on the earnings results of BAC, GS, ASML, MS, TSM, BX, and NFLX.
10/15
BAC GS UNH JNJ PNC STT PGR ACI C SCHW
UAL FULT JBHT SGH IBKR OMC EPAC
10/16
ASML MS ABT USB OFG SYF PLD CFG
AA KMI REXR LBRT PPG DFS STLD CSX
10/17
TSM BX MMC TRV SNA IRDM ELV MTB WBS CMC KEY INFY HBAN
NFLX ISRG OZK FNB MRTN WAL CCK
10/18
PG AXP RF ALV CMA ALLY FITB SLB


