In the U.S. market last week, semiconductor and large high-tech stocks led the gains, with the Nasdaq and S&P 500 reaching new highs. On the other hand, many other stocks, including Dow stocks and small caps, are in a short-term downtrend, which contrasts with the gains in stock indices.
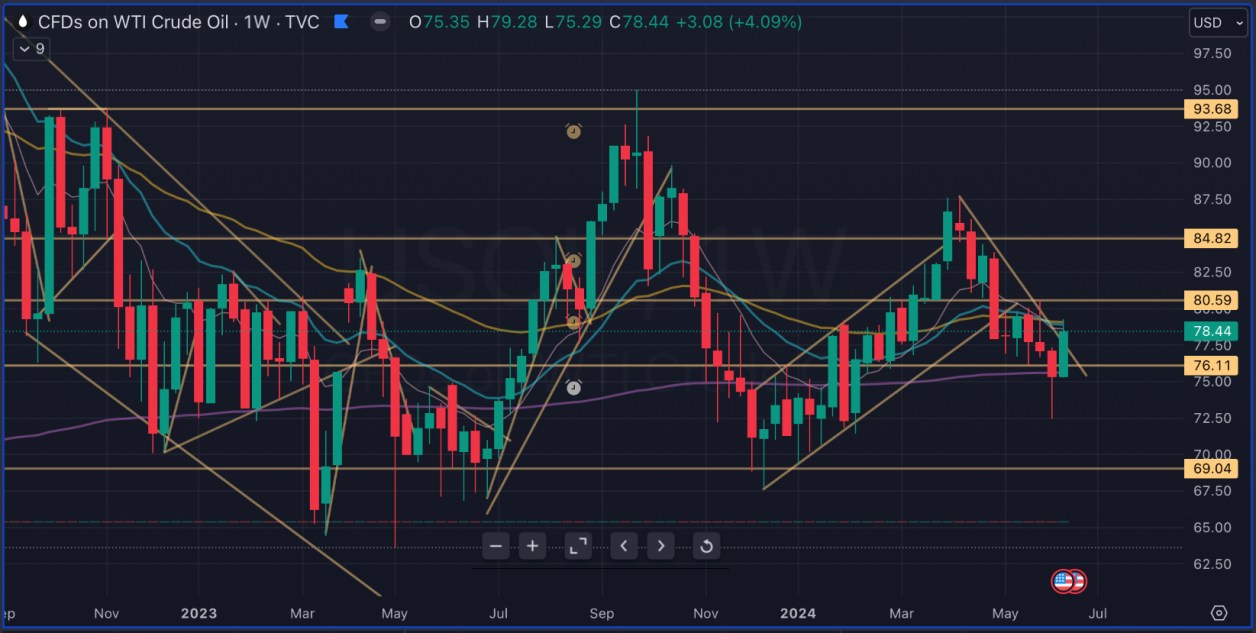
Long-term interest rates have fallen sharply, breaking below the gradual uptrend that had begun at the beginning of the year.In addition, crude oil, which has been in a downtrend since April, has seen a strong rebound and is beginning to turn the trend.In addition, crude oil, which has been in a downtrend since April In addition, crude oil, which has been in a downtrend since April, is showing a strong rebound, indicating a trend reversal.
With the exception of a few stocks, the percentage of stocks in a downtrend is increasing, so this week, I would like to take fewer swing trades and wait and see until this situation turns around.
Now, let's review last week's market by checking the chart.
Last Week in Review
Market environment
The yield on the 10-year U.S. Treasury note was down -4.78%, breaking below the uptrend line that began at the beginning of 2024.

The VIX was up +3.60%, holding at a low level in the 12 to 14 range.

NASDAQ Analysis
Here is the monthly chart of the Nasdaq, which has rallied to a new high of +6.24% at the halfway point in June. It appears to be rising somewhat too quickly. We would like to assume that the second half of the month may remain flat or even decline.

Here is the weekly chart of the NASDAQ. It was up +3.59% last week, the second consecutive week of significant gains.

The NASDAQ high-low number of stocks continues its short-term downtrend and remains in negative territory. We can see that a few large high-tech stocks are supporting the NASDAQ's rally. Until the trend in this chart turns up, the market as a whole is likely to continue its upward trend.

Dow Analysis
Here is the monthly chart of the Dow, which has continued to level off in June at -0.47%.

Here is the weekly chart of the Dow. Last week was a modest decline of -0.67%, the third consecutive week of sideways movement in small price ranges.

Analysis of the S&P 500
Here is a monthly chart of the S&P 500, which has rallied +2.75% in June. Like the Nasdaq, it has reached new highs.

Here is the weekly chart of the S&P 500. It was up +1.62% last week, its second consecutive weekly gain.

Russell 2000 Analysis
Here is the monthly chart of the Russell 2000, which is down -3.46% after the first half of June, in contrast to the other indices, which are either up or flat.

Here is the weekly chart of the Russell 2000. The Russell 2000 was down -1.21% last week; it has been in a short-term downtrend since the beginning of May and has continued to fall. Last week it rallied significantly in the first half of the week, but stalled in the second half of the week with a large upper whisker, making it a bearish chart.

Commodity Futures Analysis
Crude oil was up +4.09%, breaking above the downtrend line that began in April, the first sign of a trend reversal.

Natural gas was down -1.27%, falling once above the 2.977 resistance line.

Gold was up +1.04%, with a rebound move near the 2.28 support line.

Copper was up +0.26%. There are no clear signs that the short-term decline will stop.

Sector Analysis
Only Information Technology has gained significantly in the past week, while other sectors are either up small or down. Particularly weak sectors are energy, financials, and materials.

Looking at performance by industry, semiconductors and consumer electronics have seen particularly strong gains. There are also signs of recovery in software.
The big decliners are luxury goods, auto parts, broadcasting, and shipping.


Trend of Individual Issues
Last week, gains were led by semiconductors (NVDA, AVGO, MU, ARM), semiconductor equipment (AMAT, LRCX, KLAC), consumer electronics (AAPL), and software (MSMT, ORCL, ADBE, CDNS, SHOP).
Auto parts (MBLY, APTV), food and beverage (KHC, PEP), aviation and defense (BA, GE), and insurance (PGR, ALL) are all down.

Strategy of the Week
Although semiconductor stocks are driving the stock index higher, the overall market is seeing an increasing number of stocks in a downtrend in the short term.
This week, I would refrain from entering new swing trades and wait until the market as a whole is in a situation where stocks are bought to the upside.
Since there are fewer earnings announcements this week, we expect only a few trades to be made on earnings issues.
Since last month, I have been transferring some of my funds for short-term trading and gradually starting to build a long-term investment portfolio of high dividend stocks.We plan to continue to buy more stocks in this portfolio this week as more and more of them are falling and becoming undervalued.
Stocks to watch
We have not replaced many stocks this week.We added NFLX, which broke out to new highs.

Click here to see a chart of the stocks monitored.
Scheduled to close this week
This week we will focus on the financial results of LEN, ACN, and KR.
6/17
- LEN
- LZB
6/18
- KBH
6/19
- SCS
6/20
- ACN
- CMC
- DRI
- GMS
- JBL
- KR
- WGO
- SWBI
6/21
- FDS
- KMX


